🎨 Plotting
The plotting function originated from our needs during the development process. Initially, we focused mainly on integrating features related to geological thermometers, but as development progressed, we discovered more possibilities for expansion. Enhancing basic functions will help us achieve larger goals. 🌍
We have significantly refactored the UI and implementation logic of the plotting module. It will be different from versions prior to v0.5.0.0.
Goals
On the plotting function page, we will integrate more basic diagram templates, including but not limited to: tectonic discrimination diagrams, rock classification diagrams, basic geological thermometer diagrams, and more. In the future, we also hope to implement features like custom base maps. Our ultimate goal is to create a comprehensive collection of plotting functions for the earth sciences, providing convenience for researchers. 🧪
The classification logic for diagram templates is primarily divided into two levels:
- By discipline (current)
- Using a tag system (planned)
For the division by discipline, the preliminary categories are:
Igneous Petrology
- Rock Classification Diagrams:
- TAS (Total Alkali vs. Silica) Diagram: The TAS diagram you mentioned is placed here. It is fundamental for volcanic rock classification, with its full name being the "Total Alkali-Silica" diagram, using the formula (Na₂O+K₂O) vs. SiO₂.
- QAPF/QAP Diagram: A Quartz-Alkali Feldspar-Plagioclase-Feldspathoid diagram suitable for plutonic rock classification.
- R1-R2 Diagram: A multi-cationic classification diagram based on major elements.
- K₂O vs. SiO₂ Diagram: Used for classifying rock series (e.g., tholeiitic, calc-alkaline, shoshonitic).
- Tectonic Discrimination Diagrams:
- Various trace element ternary diagrams (e.g., Th-Hf-Ta, Zr-Nb-Y).
- Various trace element/rare earth element ratio diagrams (e.g., La/Yb vs. Dy/Yb).
- Magma Evolution & Source Tracing Diagrams:
- Harker Diagrams: Major/trace elements vs. SiO₂ or MgO.
- Trace Element Spidergrams: Chondrite-normalized, primitive mantle-normalized, N-MORB-normalized, etc.
- REE Patterns: Chondrite-normalized.
Geochemistry
- Isotope Geochemistry:
- Concordia Diagrams: Used for dating minerals like zircon.
- Rb-Sr, Sm-Nd, Lu-Hf, U-Pb Isochron Diagrams: Used for whole-rock or mineral dating.
- Initial Isotope Ratio Diagrams: Such as (⁸⁷Sr/⁸⁶Sr)i vs. εNd(t) plots, used for tracing magma sources.
- Aqueous & Low-T Geochemistry:
- Piper Diagrams: For classifying water chemical compositions.
- Stiff Diagrams, Schoeller Diagrams: For visualizing water chemistry types.
- Eh-pH Diagrams: For determining the stable phases of elements in aqueous solutions.
Sedimentology & Stratigraphy
- Sediment Classification & Provenance:
- QFL (Quartz-Feldspar-Lithic fragment) Ternary Diagrams: For sandstone classification and provenance discrimination.
- A-CN-K (Al₂O₃ - CaO*+Na₂O - K₂O) Ternary Diagrams: Indicates the degree of chemical weathering.
- Grain Size Analysis:
- Grain size frequency distribution histograms and frequency curves.
- Grain size cumulative frequency probability plots.
Geochronology
- (This category overlaps with the isotope section in Geochemistry and can be merged or kept separate based on user habits)
- Age Probability Density Plots: Used for detrital zircon age distributions, etc.
- U-Pb Concordia Diagrams, Isochron Diagrams (as above).
- etc.
Certain features may be subject to change; the current quality does not represent the final result, as some functions are still being refined and adjusted.
We welcome everyone to provide valuable feedback during use to improve the software's usability and convenience. 🌹
Quick Start
Diagram Template Library
By default, after entering the software, the plotting module will display the existing library of earth science diagram templates, which is generally divided into three parts:
- Left-side Diagram Template List: This list displays the entire hierarchy of templates and their corresponding templates.
- Top-right Diagram Template Navigation Bar: The navigation bar displays content from different levels as you click through the diagram template list.
- Bottom-right Diagram Template Cards: Displays the diagram cards under the currently selected template level, including their names and preview images.
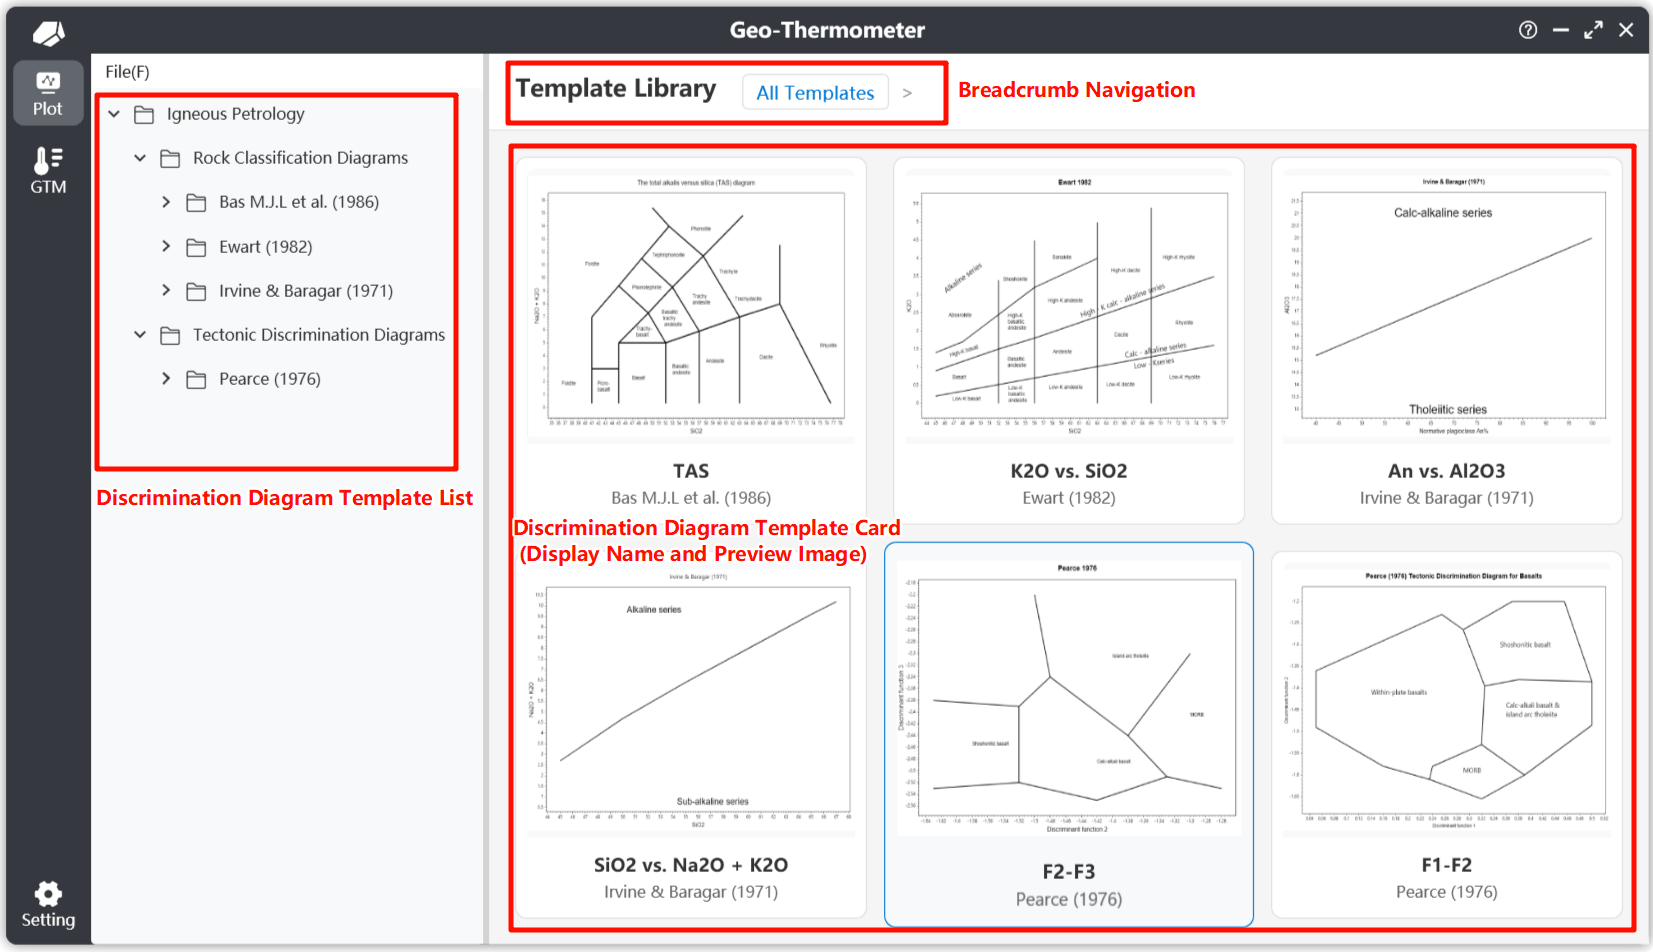
By selecting and clicking the corresponding template card, you can enter the respective diagram template plotting interface.
These diagrams are fully extensible. We use a JSON format to store the main diagram template information. In the future, we plan to implement server-side storage of template files, allowing the diagram template list to be updated by connecting to the internet without updating the software itself.
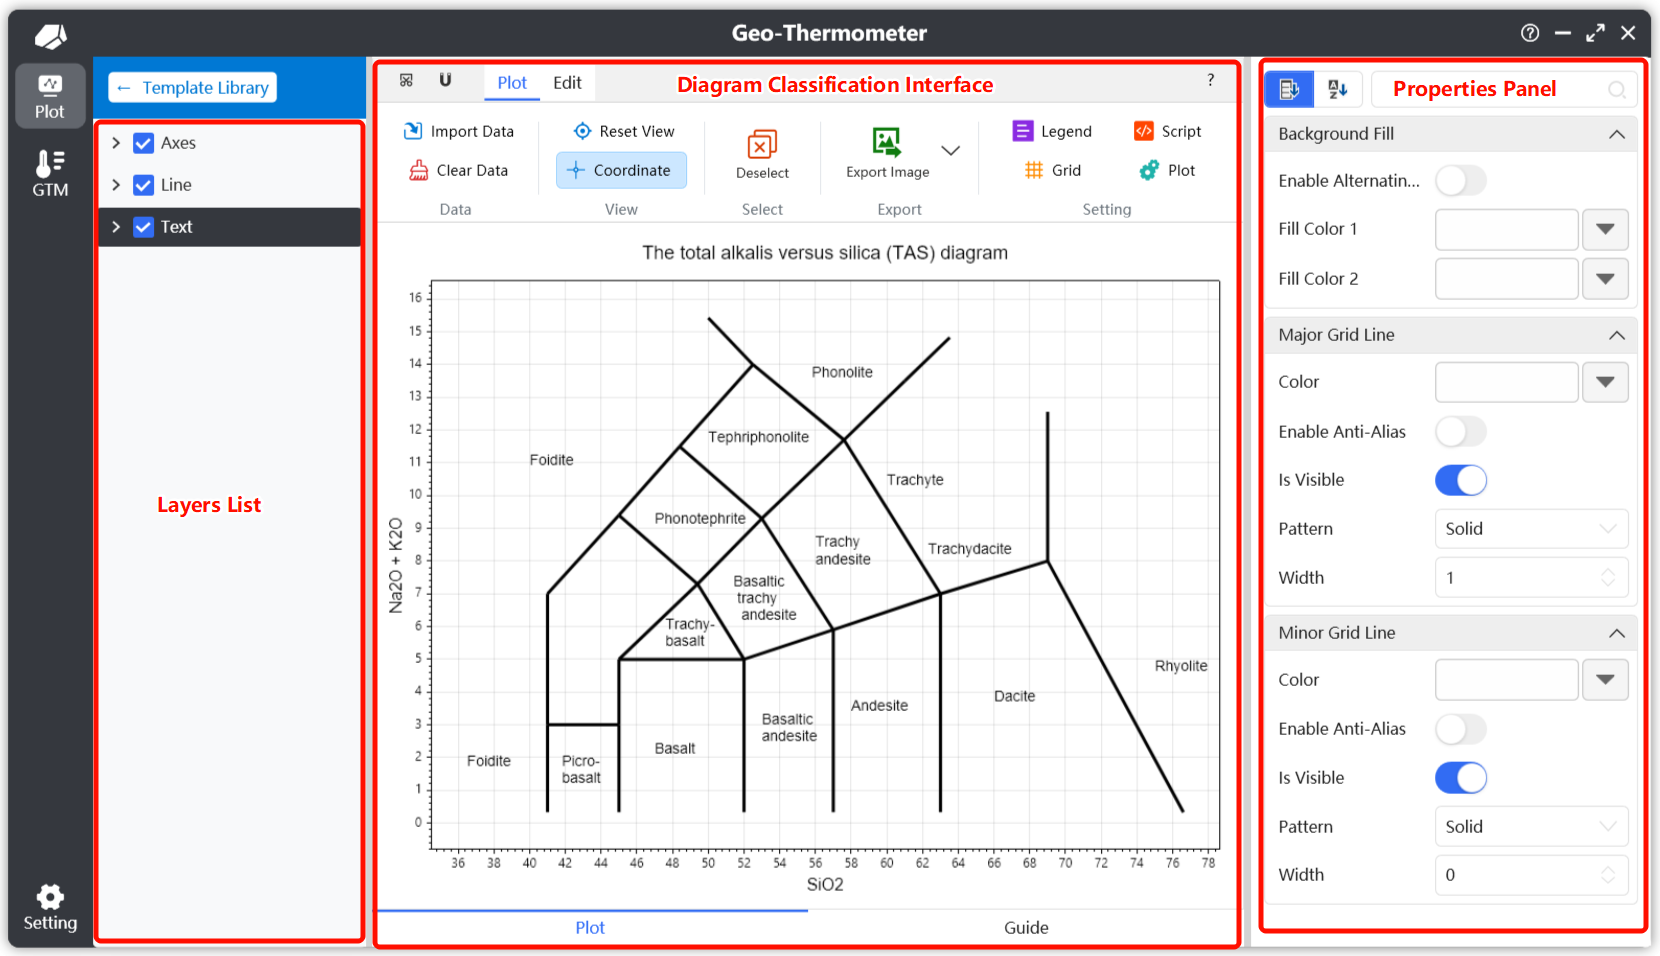
Plotting Interface
The plotting interface is mainly divided into three parts:
- Layer List Area: A list of the plotting elements corresponding to the diagram template. You can click on different plotting elements to modify their properties.
- Plotting Area: View the plotting results, import data, adjust visual settings, configure plot settings, and read template descriptions.
- Properties Panel: A list of plotting elements and their property panels. By adjusting element properties, you can achieve the desired plotting effect.
Plotting Toolbar
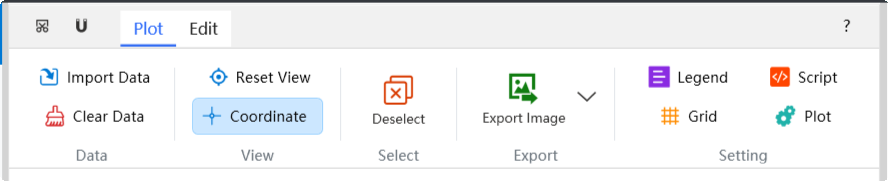
The plotting area is functionally divided into a top toolbar and bottom tabs for switching functions.
The top toolbar in the plotting area is the main section for plotting operations. This toolbar will integrate all plot control operations. We will focus on the functions on the toolbar. For normal user operation, you do not need to pay attention to the Edit toolbar, as it is designed for creating and extending diagram templates. It is not of much concern for users simply using the templates.
Quick Functions
- Copy to Clipboard: To facilitate quick access to plot results, we have designed a quick copy image to clipboard function at the very top left of the toolbar.
- Help: Quickly jump to the official website's help page.
Data
- Import Data: Clicking this will open a dialog to select a data file. It supports reading
.csv,.xlsx, and.xlsformats. After reading the data, data points will be plotted according to the rules of the different base diagram templates. - Clear Data: Clicking this will clear all plotted data points.
View
- Reset View: Resets the coordinate view to the optimal center display.
- Locator Axis: Shows/hides the position locator axis; when enabled, it will display the real-time coordinate data of the mouse cursor within the plot.
Selection
- Deselect: Deselects all selected objects.
Export
- Export: Export the image in formats such as
.png,.jpg,.bmp,.webp, and.svg.
Settings
- Legend Settings: Configure legend settings, such as legend position, arrangement, and visibility.
- Plot Settings: Adjust plot settings, such as the content, font, and color of axis titles.
- Script Settings: This refers to the data point calculation rules for the current diagram template, which ultimately enables data plotting. Users do not need to be concerned with this property when using the default plotting function.
- Grid Settings: Set the grid properties of the plotting interface.
Some features may not yet be fully implemented; we are working hard to improve them to provide a better user experience. ✨
Diagram Guide
At the very bottom of the plotting area, there are two tabs: Plot (default) and Guide.
In the Guide interface, you can see some basic information about the current plot, including but not limited to:
- Data import format requirements
- Basic information about the diagram template
- References for the diagram template
- Contributors to the diagram template
Layer List
Plotting elements are divided into 7 main types:
- Line: Defines the line segments of the base map boundary elements.
- Text: Text elements used for labeling in the plot.
- Annotation: A special type of text that does not change size with zooming (planned).
- Polygon: Polygons in the plot.
- Axes: The coordinate axes used for the plot.
- Data Point: The data point elements from the imported data.
- Point: Individual point elements.
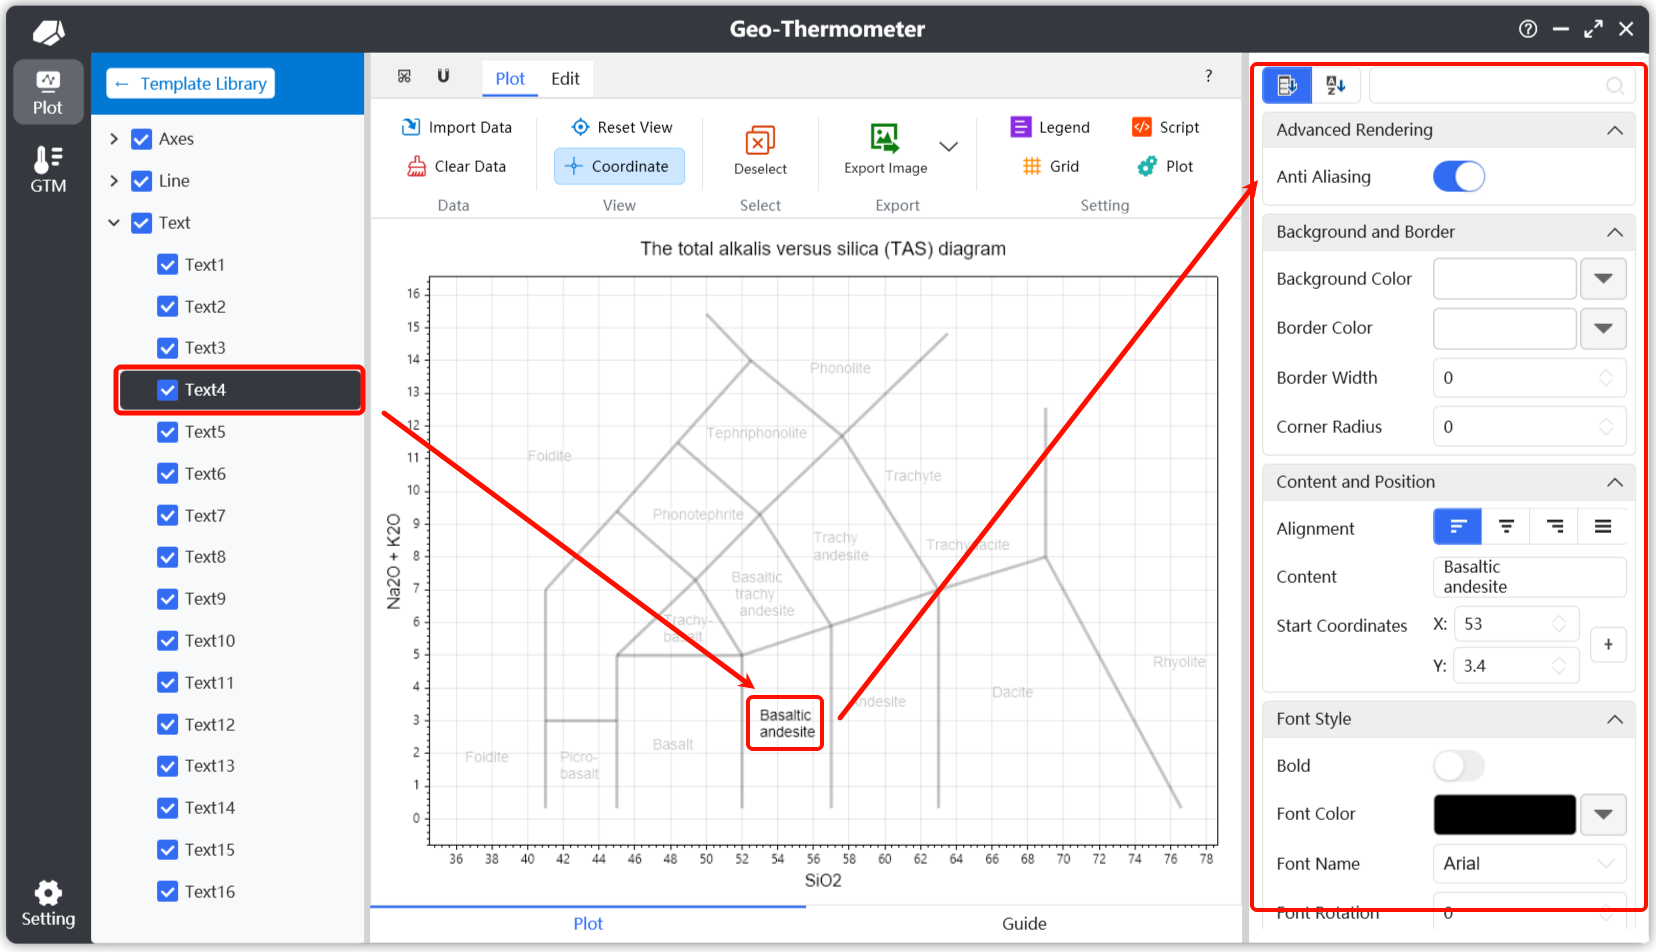
When you select a plotting element in the layer panel, that element will be highlighted in the plotting area, while other elements will have their opacity reduced to minimize interference. The corresponding properties panel will also display the relevant properties of the selected plotting element. 🔍
Achieve the desired plotting effect by modifying the properties of the plot objects.
To deselect all selected elements, you can use the Deselect button on the plotting toolbar.
Usage Example
First, select the desired plotting template from the diagram template list to enter the plotting function page.
Then, check the Guide tab at the bottom to understand the basic information for the current plot, mainly the data import format requirements.
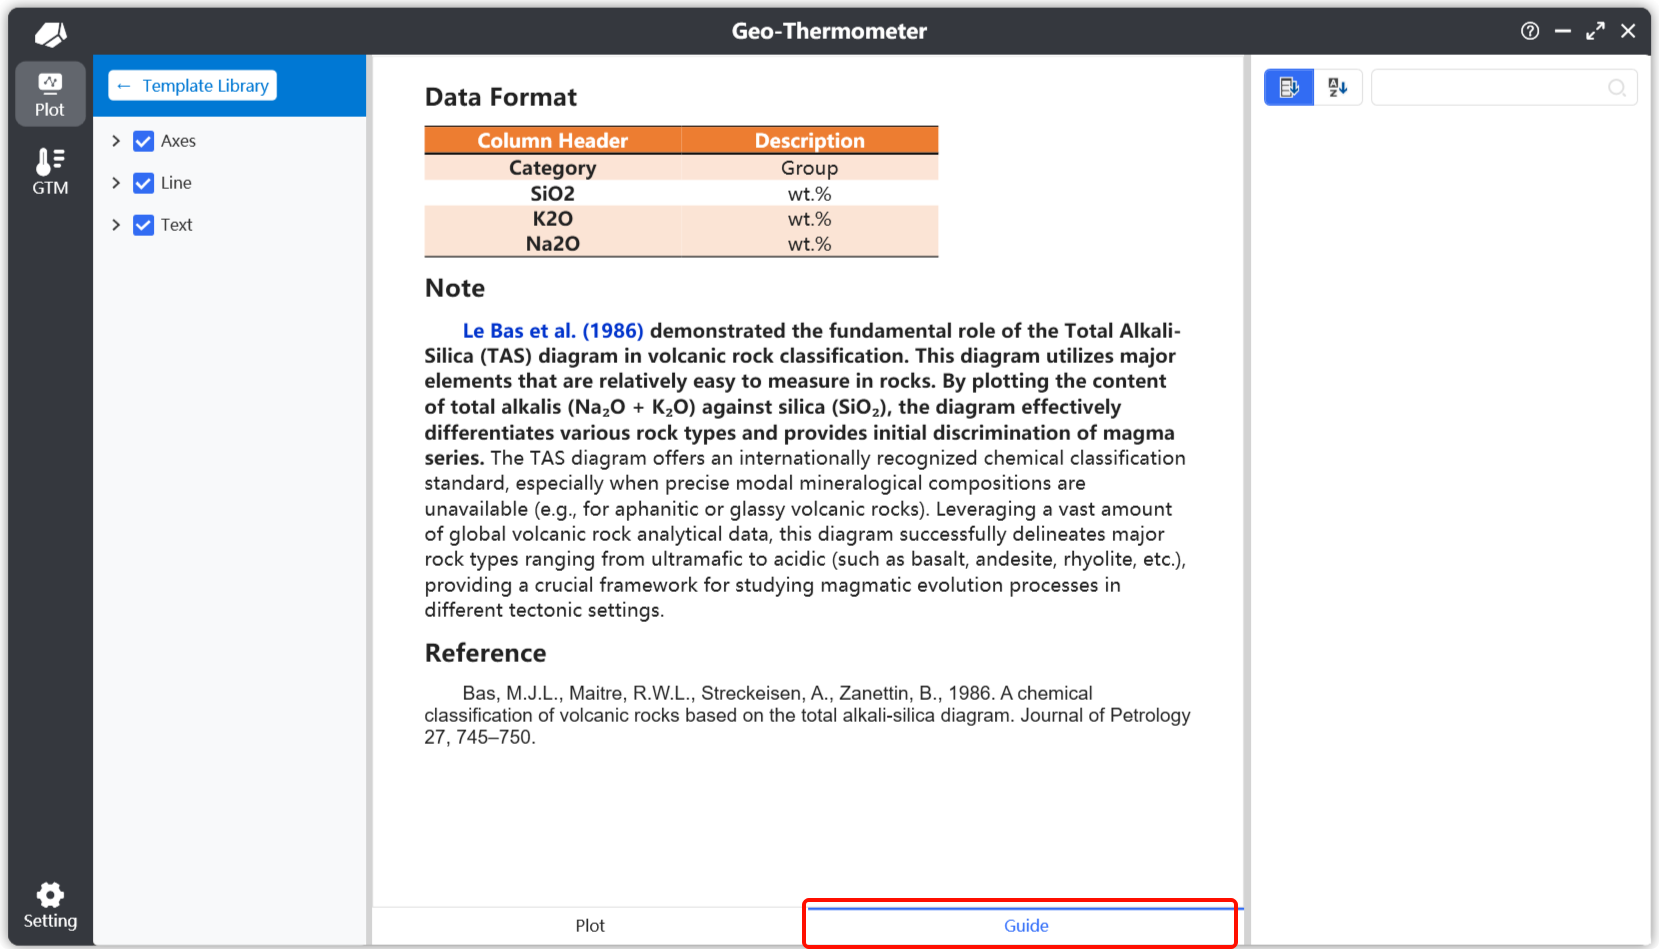
From here, you can see the required format for the imported data file. For example, for an .xlsx file, it defaults to the first worksheet, with the first row as the header. The header must include column names: Category, SiO2, K2O, and Na2O. The unit for geochemical elements is wt.%, and the Category header is used to group the imported data to generate different legends.
After understanding the basic information, click Import Data to plot the data. After modifying the plot settings, export the final result to complete the workflow.
Multi-language Instructions
It should be noted that the software has the ability to switch languages in real-time. For the plotting module, if the language is switched while plotting is active, some text may not be updated. This is because some language displays are fetched in real-time, meaning a relevant action is needed to refresh the content.
There are several ways to trigger a refresh, including but not limited to clicking on the diagram template list or re-entering the plotting view.
The best solution is to switch to the desired language before using the plotting function. Alternatively, restart the software after switching the language.