🎨 Plot
The plotting functionality arises from the derived needs during our development process. Initially, we focused mainly on integrating features related to geological thermometers, but as the development progressed, we discovered many more possibilities for expansion. Enhancing the basic functionalities will help us achieve a larger goal. 🌍
Goals
On the plotting function page, we will integrate more base maps, including but not limited to: tectonic setting discrimination maps, rock classification maps, geological thermometer base maps, etc. In the future, we also hope to implement custom base maps and more. Our ultimate goal is to create a comprehensive collection of plotting functionalities for Earth sciences, providing convenience for researchers. 🧪
Some features may undergo changes; current quality does not represent the final result, as some functionalities are still in a refinement and adjustment phase.
We welcome everyone to provide valuable feedback during usage to enhance the software's usability and convenience. 🌹
Feature Description
Interface Area Description
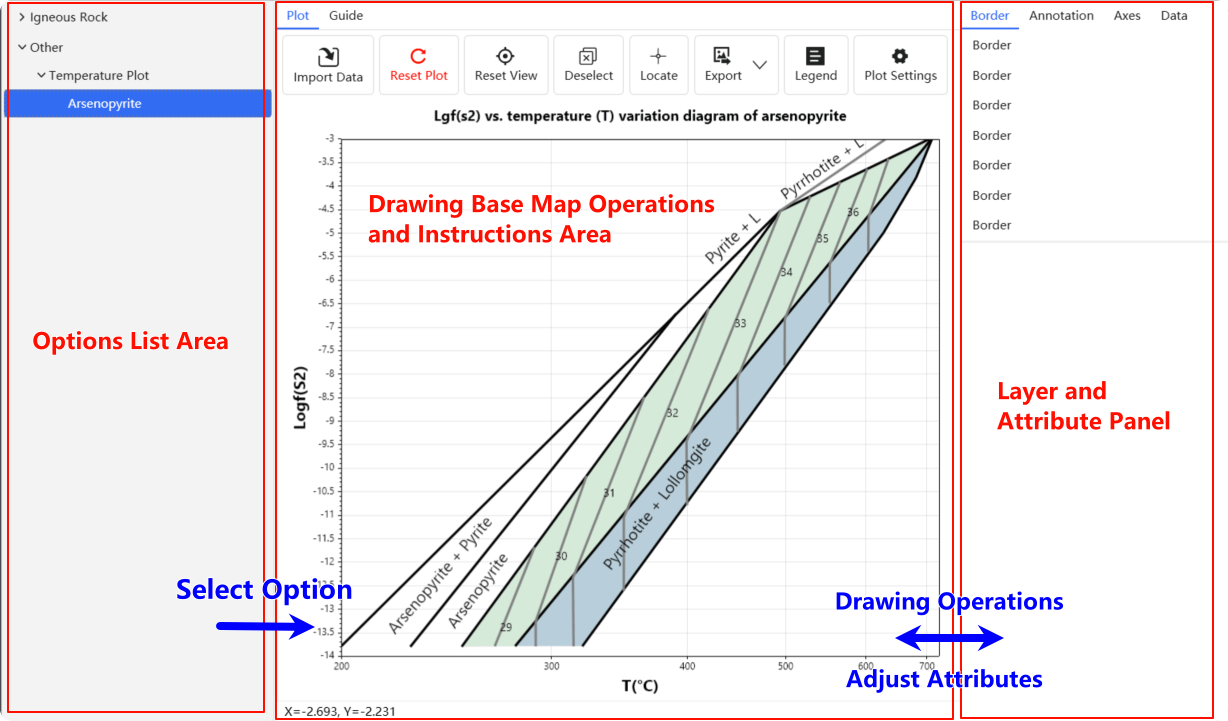
The interface functionalities are mainly divided into three parts:
- Options List Area: Selecting different plotting base map templates.
- Drawing Base Map Operations and Instructions Area: Viewing plotting effects, data import, visual settings, plotting settings, and explanations of the templates, etc.
- Layer and Attribute Panel: A list of plotting elements and their attribute panels. By adjusting the element attributes, the desired plotting effects can be achieved.
Plotting Area Description
The plotting area is generally divided into two functional pages:
- Plotting Function Page: All operations related to the plotting base maps are conducted here.
- Guide Function Page: Basic explanations of the base map templates, including brief descriptions, applicable situations, and references for sources.
In the plotting function page, we focus on explaining the functionalities on the toolbar:

- Import Data: Read data in
.csv,.xlsx, and.xlsformats. After reading the data, point plotting will be completed according to the rules of different plotting base map templates. - Reset Plot: Reset the plotting base map template to its initial state. Any plotting operations will be reset.
- Reset View: Reset the viewpoint to the center of the display.
- Deselect: Deselect all selected objects.
- Locate: Show/hide the position locator axis; when enabled, it will display specific coordinate data.
- Export: Export images in formats such as
.png,.jpg,.bmp,.webp, and.svg. - Legend: Legend settings, such as legend position, arrangement, and visibility.
- Plot Settings: Plot settings, including content for plotting/coordinate axis titles, font, color, and background grid styles, etc.
Some functions may not yet be fully implemented; we are working to improve them to provide a better user experience. ✨
Plotting Element List
Plotting elements are categorized into four main types:
- Border: Line segments that define the boundary elements of the plotting base map.
- Annotation: Text elements in the drawing for labeling.
- Axes: Coordinate axes for plotting.
- Data: Imported data point elements.
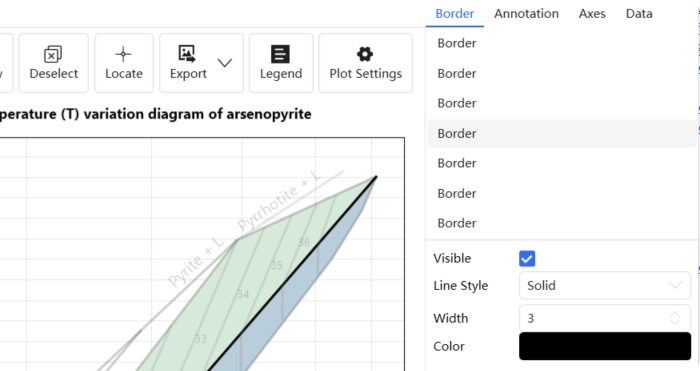
Once you select the corresponding plotting elements, they will be highlighted in the plotting area. You can use the Shift key for continuous selection or use the Ctrl key for adding or removing selections. 🔍
To deselect all selected elements, you can use the Deselect button on the plotting toolbar.